


One of the limitations of SQL Server Management Studio is that it shows query execution time in seconds. In most daily activities, this is accurate enough. But when it comes to query permanence tuning, it is helpful to have a more accurate measurement.
Here are a 3 different ways to show you an accurate query execution time:
Statistics On
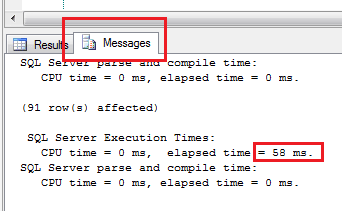
To have your exact query time show in the separate messages tab, all you need to do is run the following queries.
SET STATISTICS TIME ON

GO

-- Insert query here

GO

SET STATISTICS TIME OFF

GO
Then you can view the time by clicking on the Messages tab.
Include Client Statistics
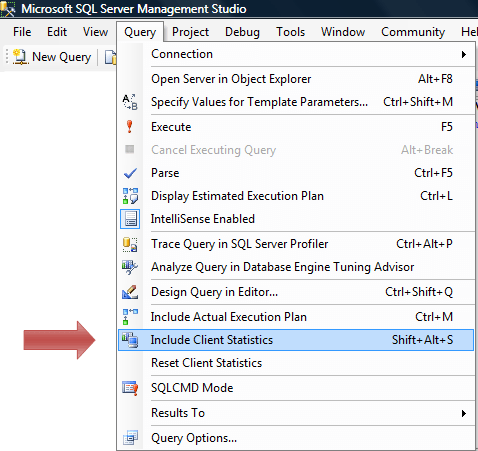
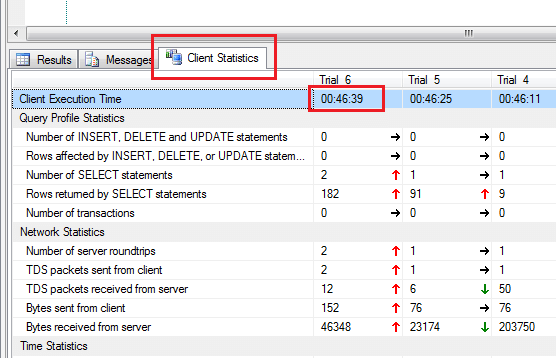
To get a lot of in-depth information about your query, you can turn on Client Statistics before running your query. The details of all the results will be shown in the Client Statistics tab after execution was completed.
Turn on client statistics by choosing the Include Client Statistics option from query menu.
You can then view the query time by looking under the Client Statistics tab by your query results
Inline Query Time Results
If you would like to just show the execution time in the standard results window, this query allows you to do this. It will also allow you to show exact time of execution of a specific code segment in a query.
To use this, just place the code that you would like to get the execution time for in the center of the below script. The exact time will be shown in the results.