SQL Server 2014 Feature – Timeout For Online Index Rebuilding

Facebooktwitterredditpinterestlinkedinmail

SQL Server 2014 comes with a new argument for how to handle the blocking issues that come from online index rebuilds.

 
Before SQL Server 2014

Before the existence of SQL Server 2014, if you were doing an online index rebuild… SQL Server would wait until the index rebuild could get the locks that it needs for rebuilding the index.  This can cause long running maintenance plans on very active tables.

 
SQL Server 2014 Online Index Rebuild Argument

The new functionality available in SQL Server 2014 tags on to the original index/table rebuild syntax.  It allows you to customize how you want to handle the blocking that occurs on the indexes/tables that are being rebuilt.  Here is a sample of the new syntax for managing the blocking on the index rebuild.

ALTER	INDEX ALL
ON		Animal
REBUILD	WITH
(
	SORT_IN_TEMPDB = ON,
	STATISTICS_NORECOMPUTE = OFF,
	ONLINE = ON ( WAIT_AT_LOW_PRIORITY ( MAX_DURATION = 4 MINUTES,
									     ABORT_AFTER_WAIT = BLOCKERS ) )
)

Notice in the statement above, the new WAIT_AT_LOW_PRIORITY flag that gets added to the ONLINE argument.  When you rebuild an index in SQL Server with the WAIT_AT_LOW_PRIORITY flag turned on, it will allow other operations to proceed while the index build waits for low priority locks.  This argument comes with 2 parameters.

 
MAX_DURATION

The MAX_DURATION parameter is how long you want to wait in minutes.  It must always be in minutes.

 
ABORT_AFTER_WAIT

This parameter comes with 3 options.  This is basically who loses if the rebuild process cannot get the locks that it needs.  The connection that you choose will be terminated after the timeout period.

  • NONE – Continue waiting for the lock
  • SELF – The rebuild operation will fail
  • BLOCKERS – All transactions that are blocking the rebuild will be killed

 
If you do not specify WAIT_AT_LOW_PRIORITY with you index rebuild, then SQL Server will automatically set it to the default of 0 minutes and NONE.


Index Reference:  http://msdn.microsoft.com/en-us/library/ms188388.aspx

Table Reference:  http://msdn.microsoft.com/en-us/library/ms190273.aspx
 

SQL Server Pagination

Facebooktwitterredditpinterestlinkedinmail

Paging through data is something that developers need to do frequently.  Until SQL Server 2012, the best way to achieve this is with the ROW_NUMBER function… and let’s face it… that wasn’t the easiest/most elegant thing to use.  Our prayers have been answered in SQL Server 2012.  The SQL Server team has come out with a better way of doing pagination using the OFFSET FETCH clause.

 
The OFFSET FETCH Clause

The OFFSET FETCH clause allows the client application to pull only a specified range of records.  To implement pagination using the OFFSET FETCH clause, it takes two parts… the OFFSET and the FETCH. 🙂

NOTE: To use the OFFSET FETCH clause for pagination, you must use an ORDER BY clause as well.

 
OFFSET

This part tells SQL Server to skip N number of rows in the result set.

SELECT	*
FROM	Animal
ORDER	BY AnimalName ASC
OFFSET	50 ROWS

The above statement tells SQL Server to return all of the AnimalNames in the Animal table, but only return the names after the 50th.  So 51 and beyond.

 
FETCH

This part tells SQL Server how many records to return in the result set.  If you use FETCH, you always need to use OFFSET.

SELECT	*
FROM	Animal
ORDER	BY AnimalName ASC
OFFSET	50 ROWS
FETCH   NEXT 10 ROWS ONLY

The above statement tells SQL Server to return the AnimalNames in the Animal table with row numbers 51-60.  The OFFSET clause tells it to skip 50 rows and the FETCH clause tells it to return 10 records.

 
Variable Row Counts

You are also able to use a variable for the record counts in the query.  If you wanted to do this, it would look like this:

SELECT	*
FROM	Animal
ORDER	BY AnimalName ASC
OFFSET	@RowsToSkip ROWS
FETCH	NEXT @RowsToReturn ROWS ONLY


Reference: http://technet.microsoft.com/en-us/library/gg699618(v=sql.110).aspx


Show Query Execution Time

Facebooktwitterredditpinterestlinkedinmail

One of the limitations of SQL Server Management Studio is that it shows query execution time in seconds.  In most daily activities, this is accurate enough.  But when it comes to query permanence tuning, it is helpful to have a more accurate measurement.

Here are a 3 different ways to show you an accurate query execution time:

 
Statistics On
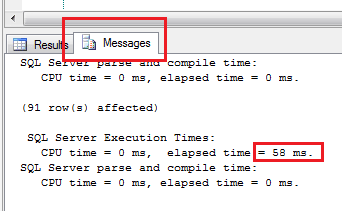
To have your exact query time show in the separate messages tab, all you need to do is run the following queries.

SET STATISTICS TIME ON

GO

-- Insert query here

GO

SET STATISTICS TIME OFF

GO

Then you can view the time by clicking on the Messages tab.

Show Query Execution Time

 
Include Client Statistics
To get a lot of in-depth information about your query, you can turn on Client Statistics before running your query.  The details of all the results will be shown in the Client Statistics tab after execution was completed.

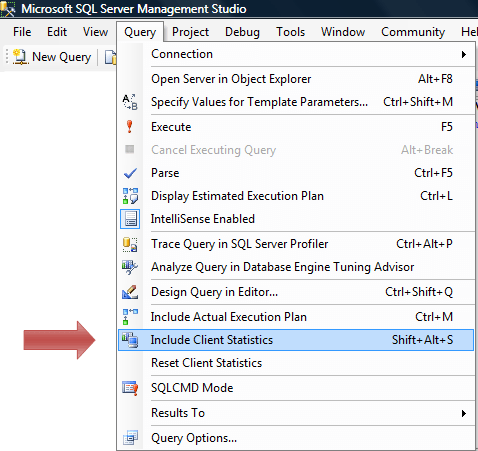
Turn on client statistics by choosing the Include Client Statistics option from query menu.

show query execution time client stats

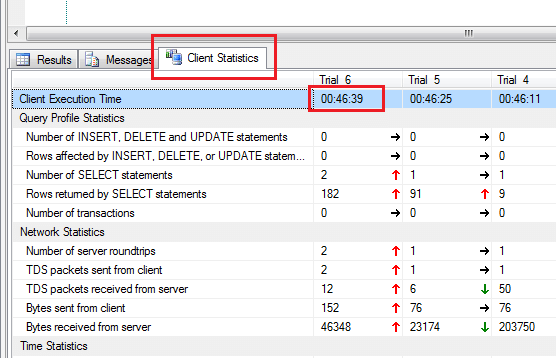
You can then view the query time by looking under the Client Statistics tab by your query results

Show Query Execution Time Client Stats

 
Inline Query Time Results
If you would like to just show the execution time in the standard results window, this query allows you to do this.  It will also allow you to show exact time of execution of a specific code segment in a query.

To use this, just place the code that you would like to get the execution time for in the center of the below script.  The exact time will be shown in the results.

DECLARE @Time1 DATETIME

DECLARE @Time2 DATETIME

SET     @Time1 = GETDATE()

-- Insert query here

SET     @Time2 = GETDATE()

SELECT  DATEDIFF(MILLISECOND,@Time1,@Time2) AS Elapsed_MS

Reference:  http://technet.microsoft.com/en-us/library/ms190287.aspx